A few weeks back a set of benchmark results comparing JDK 8 and JDK 14 were published by Phoronix. The SPECjbb® 2015 results presented in that report really caught our eyes. They don’t compare to what we have seen in our own testing and this needed some investigation. Before digging in to what we found, I’ll start off with some background on one big difference between JDK 8 and JDK 14.
The switch
Over the last 6 years, since JDK 8 was released, the Java platform has evolved a lot. I will not go into details, but one thing is certain, the overall performance has improved a lot. One big change we made in JDK 9 was to make G1 the default garbage collector. Parallel GC, the old default, focused on raw throughput and this change shifted the platform towards a more balanced model where latency is as important as throughput.
G1 is designed to avoid the long occasional full collections that eventually occur with a stop-the-world collector, like Parallel GC. To achieve this G1 does parts of the collection work concurrently with the Java application. This comes with a slight throughput cost and it becomes extra visible in benchmarks only measuring throughput. If people observed a performance drop when migrating from Java 8 to a later version of Java, this was the main reason, i.e. a shift in the GC approach to be more latency and throughput balanced. Applications that want maximum throughput can switch back to Parallel GC (by using JVM option -XX:+UseParallelGC) and take advantage of all other performance improvements JDK 14 comes with.
JDK 8 vs JDK 14
SPECjbb®1 2015 is a good benchmark to measure the overall performance of Java and also the impact of different GC algorithms. We run it continuously in our testing. Most of the time we tune it to run with a fixed heap size, because this is a well known and good practice to get stable and reproducible results. Setting a fixed heap, using JVM options -Xmx4g -Xms4g, we get results like this.
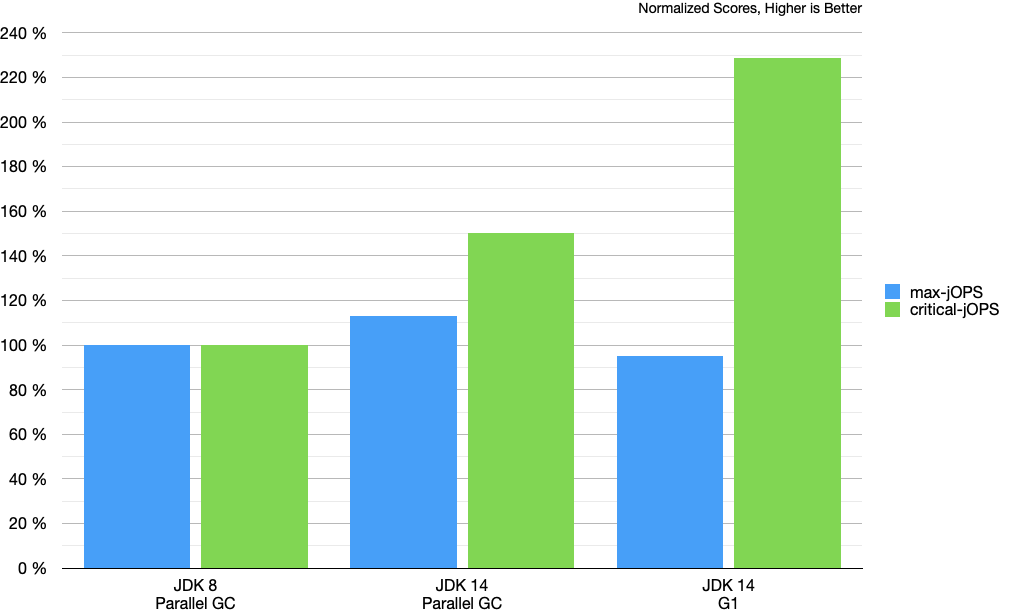
The metrics max- and critical-jOPS both measure throughput. The difference is that critical-jOPS takes latency requirements into account. The chart shows one of the reasons that make G1 a suitable default GC. The throughput tradeoff is small compared to the latency gain.
Unexpected results
The results presented in the Phoronix report were quite different. They saw big regressions for both metrics when comparing JDK 14 to JDK 8. To be able to analyze the problem, we wanted to reproduce the regression. There was no information on what options were used, only that the system under test had 16 GB of RAM. To mimic a system like this we ran the benchmark with -XX:MaxRAM=16g and no other options. This will render a heap with the initial size of 256 MB and a maximum of 4 GB. It would be the same as setting the JVM options -Xmx4g -Xms256m.
The expectation was that the results would be a bit worse than with a fixed heap size of the same size, but nothing like this.
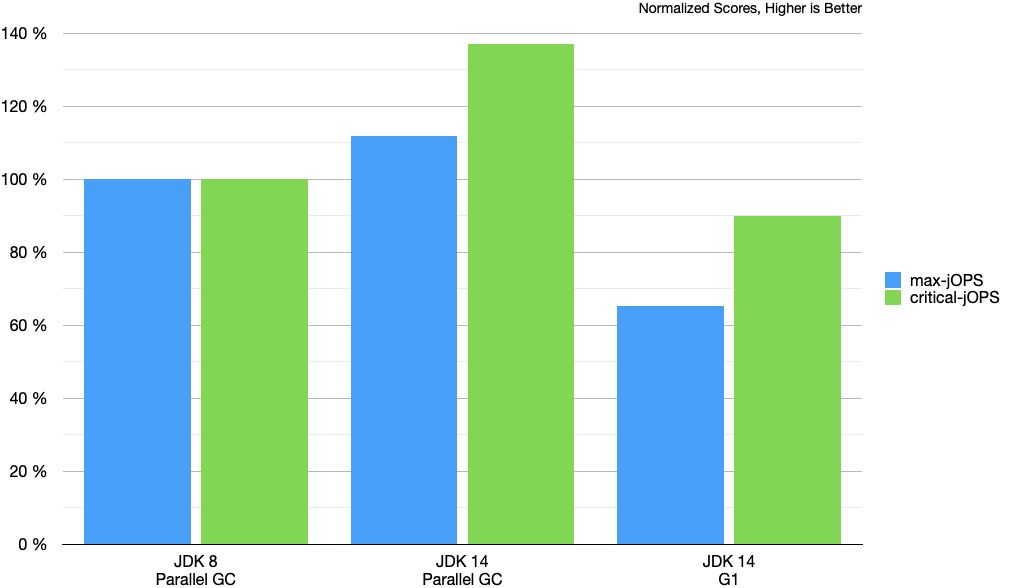
These results are worse than expected and analyzing the GC logs showed one clear difference between running with a fixed heap and not. The heap region sizes was different. Apart from doing work concurrently, another important feature in G1 is to divide the heap into multiple regions of a fixed size. G1 can collect these regions individually and this enables G1 to avoid costly full collections. In this case, a somewhat restrictive calculation of the region size and a characteristic of the benchmark had the opposite effect.
The size of the regions is determined at startup and the default calculation takes both the initial and maximum heap size into consideration. The effect is that out of the box a 1 MB region size will be used, while for the fixed heap case the region size will be 2 MB. It might sound like a small difference, but the benchmark uses a significant amount of large objects that need special treatment when using 1 MB regions. This special treatment leads to a lot of memory that can’t be used, which in turn leads full collections and a poor overall experience.
We decided to address this problem right away and a change to improve the behavior has already been pushed to JDK 15 (JDK-8241670). The basic idea is to aim for a larger region size by default and this is achieved by:
- only considering max heap size when determining region size
- rounding up the region size to the nearest power of 2 instead of rounding down
This is how the performance looks after this change.
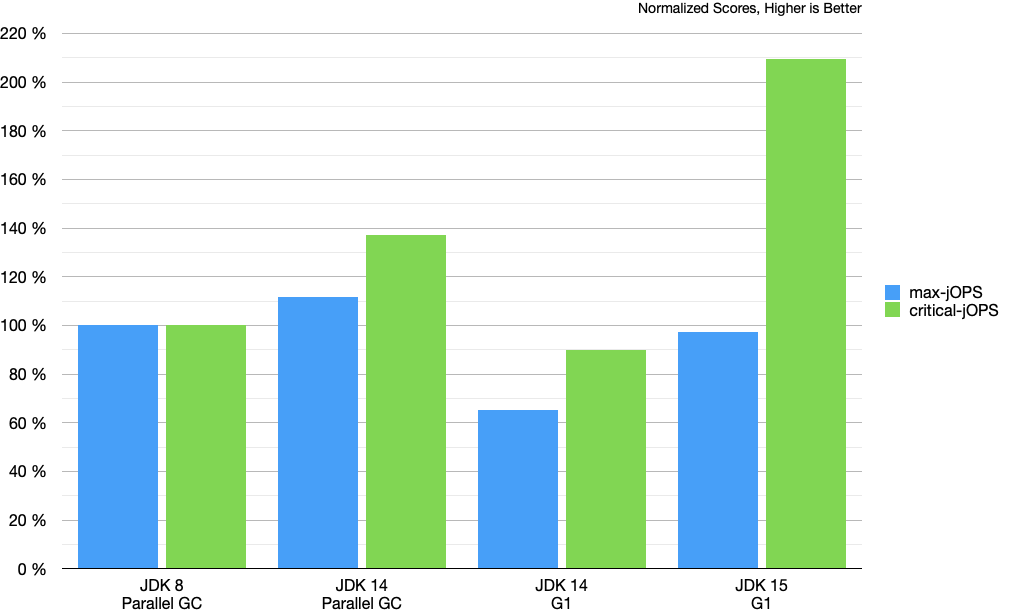
A really nice improvement to the G1 out-of-the-box performance.
A quick look at pause times
As I mentioned, with G1 we trade some throughput for better latency. Let’s take a quick look at what this means when it comes to GC pause times when running SPECjbb® 2015. To better compare pause times, I’ve run the benchmark in research mode with a fixed injection rate at around 80% of max-jOPS reported by the compliant run. This simulates a system under pressure but not really pushing it to its max. There is no score when running the benchmark in research mode, but the run fails if the GC can’t keep up with the injection rate.
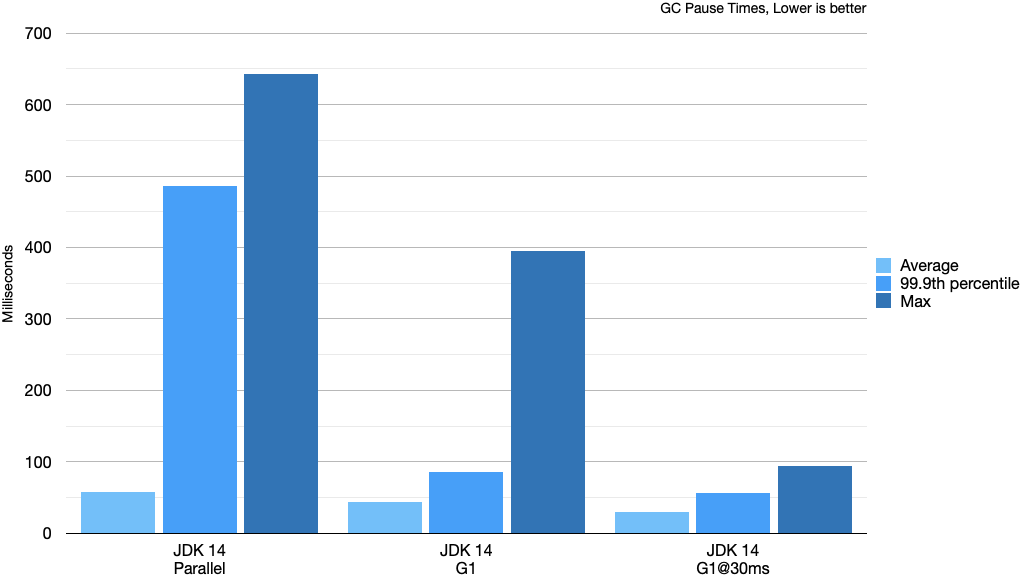
These pause times are from a one hour long run. G1 is able to avoid the long full collection, so the 99.9th percentile pause times look really good. All these runs are done with a fixed heap at 4 GB. For the G1@30ms run I also set: -XX:MaxGCPauseMillis=30. This is the main tuning option for G1. When setting this option, in this case to 30 ms, G1 will aim for 30 ms long pauses, and as we can see it does a very good job keeping the pauses short.
Better out-of-the-box performance
The goal for all GCs, and for Java as a whole, is to have good performance without any tuning. This is hard since there is such a big variety of applications out there. One step towards this goal was to make the Java platform care more about latency and therefore we switched the default GC to G1 in JDK 9. We are continuously improving G1 and this change is yet another step towards a better out-of-the-box experience.
One other nice side effect of this change is that it improves startup. Having fewer regions in the heap means less work during startup, and also a reduction in footprint overhead. I told our startup expert Claes about this and managed to lure him into GC territory. He found a few more inefficiencies to clean up and managed to reduced the startup and footprint overhead even more. Make sure to visit Claes’s blog if you are interested in Java startup performance.
-
SPEC® and the benchmark name SPECjbb® are registered trademarks of the Standard Performance Evaluation Corporation.
For more information about SPECjbb, see www.spec.org/jbb2015/ ↩